


Fiedler Data Import is run by the people who already run MAS. This article shows what the OpenShift and the Maximo administrators do to install it, what the app reports while it runs, how its data is backed up, and how scripts and build servers use it.
Two people, two halves
The installation splits along the two roles a MAS installation already has.
- The OpenShift administrator deploys the app into the MAS core namespace: one pod per Manage workspace, a data volume of 5 GiB, and a Route under the suite’s own domain. Monitoring is optional.
- The Maximo administrator installs the Manage side, gives users access, and hands out the command line client.
The companion app article shows what runs where. This one is about the work around it.
The deploy: one script
The OpenShift administrator writes a small overlay for the cluster, with the namespace, the domain
and the routing, and runs one script. It checks the login, creates the secrets the app needs,
applies the overlay, creates the Route once the certificate is issued, registers the app with MAS’s
sign-in, and waits for the rollout. A good run ends with a call from the app to MAS’s internal API
that answers 200, and the line DONE: open https://<host><path>/.
A later update needs only the new image. The same script applies the overlay with the new digest and leaves the secrets, the Route and the sign-in registration as they are. Our own pipeline runs exactly this command after every build.
The Manage side: one button
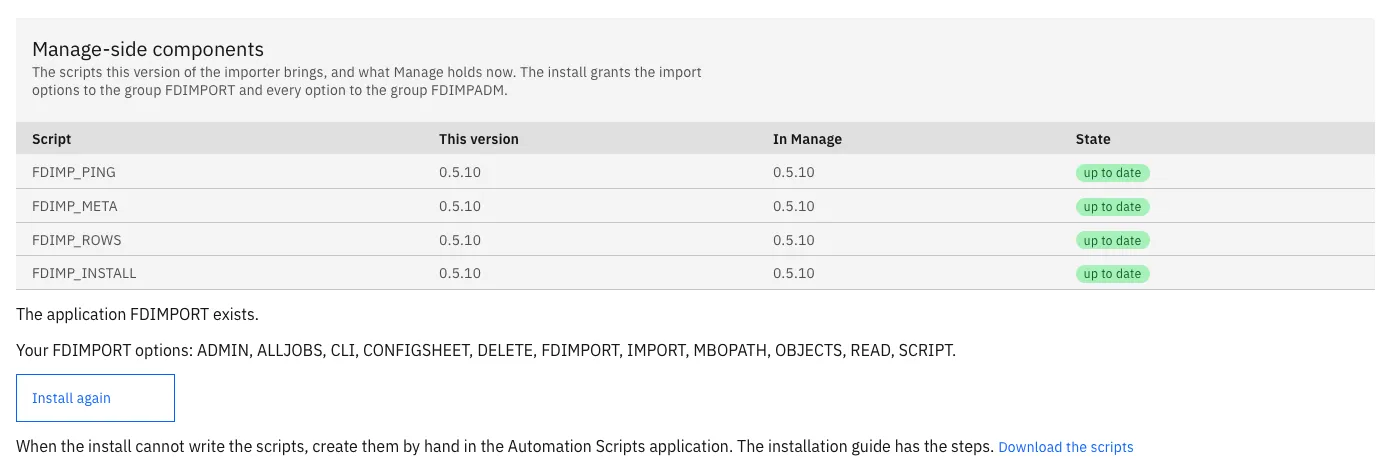
The Maximo administrator opens the app’s administration screen, accepts the licence agreement once, and presses Install or upgrade. The app writes its four automation scripts, its application with the signature options, and its two security groups, with the administrator’s own sign-in. The install is safe to repeat, and it changes only what differs.
The screen shows each script’s version in the app and in Manage side by side. After an upgrade of the app, a newer script reads “outdated” until the administrator installs it. Where an installation may not write scripts, the same screen offers them as a download, to create by hand.
Metrics and eight alerts
The app serves Prometheus metrics on a port of its own. They count jobs by outcome, rows by action and errors by category, and they time each stage of a job and each request to Manage. They also report the free space of the data volume and whether the last settings file passed its check. No label carries a user name, a job, a file name or a cell value.
The app also measures its own event loop. fdi_event_loop_lag_seconds shows how late a timer fires,
and each stall counts with its cause: busy when our own code held the loop, not-running when the
pod got no CPU. The second cause showed us why a busy node restarted a pod in the middle of a job.
With a CPU request of 10m, the node gave the pod almost no CPU, the pod missed its liveness probe,
and Kubernetes restarted it. Both apps now request 250m CPU.
Jobs wait in a queue when they must. The app runs as many jobs at once as the setting
Jobs.Concurrent allows, and two jobs that write the same main object, such as assets, take turns. A
queued job starts by itself when its turn comes.
With the monitoring component, the deploy adds eight alerts, each with a severity, so your Alertmanager decides where they go:
| Alert | Fires when |
|---|---|
FdiJobsFailing |
More than a fifth of the last hour’s jobs failed |
FdiManageFailing |
More than a fifth of the requests to Manage failed for ten minutes |
FdiQueueLong |
More than five jobs have waited for a free slot for 15 minutes |
FdiJobWaitsForOwner |
A job has waited for its owner for two hours |
FdiVolumeLow |
The data volume has less than a tenth free |
FdiScriptsOutdated |
A script in Manage differs from the version the app expects |
FdiConfigRefused |
A settings change was refused, and the previous settings stay |
FdiDown |
The app has not answered Prometheus for five minutes |
The administration guide explains each alert and what to do about it.
A Grafana dashboard comes with the app as code. Its first row shows what needs a person now: failed and busy jobs, jobs that wait for their owner, the queue and the volume. The second row shows whether the installation is sound: the licence, the scripts in Manage, the settings, the app’s version and the Manage version it talks to. The app reads the Manage version from MAS at start and every ten minutes, so the dashboard follows an upgrade of Manage. Below them, graphs show what the app did and how Manage answers.
A report of every import
An auditor asks who imported what, and when. fdi report answers with one line per ended job of
every user, oldest first. Each line holds the start and end time, the job, the user, the
application, the object, the path, the state, the duration, and the count of each action:
inserted, updated, deleted, skipped, failed, unchanged and in doubt. The report holds no file name,
no cell value and no address.
The lines come from the app’s audit table, so a job stays in the report after its files are purged. The report comes as CSV or as a workbook, for a time range, a user or an object. It needs the option to see all jobs, because it shows the work of every user.
Upgrades and backup
An upgrade is a new image. Only one pod may hold the data volume, so the old pod stops before the new one starts, and a short interruption follows. Choose a quiet time: a job that was running waits for its owner, who resumes it, and the app checks Manage before it sends a row again. After the app, the administrator installs the new scripts with the same button.
The data volume holds the jobs: uploads, plans, results and logs. Two ways keep it safe. The cluster’s own volume backup covers it like any other volume, taken when no job runs. A backup script writes the volume to a file while the app runs. It copies the job index consistently and refuses while a job is busy. On our cluster it saved 1.8 GB with 3,038 jobs in 17 seconds. A restore script puts such a file back and counts the jobs it restored.
The command line client
fdi comes as a single file for Linux, macOS and Windows. It does what the screens do:
upload and plan, run, read results and logs, resume and review, purge, and run test suites. People
sign in through the browser; scripts use a Maximo API key, from the keychain, an environment
variable or a file only its owner can read.
$ fdi import assets-delete.xlsx --app ASSET --run --wait
j_0mvcwuzp954fb9f4f72a6dd150dc4
job j_0mvcwuzp954fb9f4f72a6dd150dc4 PLANNED (mbo): plan delete 2
  Simple: ASSET delete 2
job j_0mvcwuzp954fb9f4f72a6dd150dc4 RUNNING
job j_0mvcwuzp954fb9f4f72a6dd150dc4 DONE: run delete 2
Real output from our test system, as the command line reference records it.
Every command ends with an exit code a script can test: 0 for a clean job, 1 when rows failed, 5
when no sheet of the plan can run, and more for a refused sign-in or an unreachable app. A profile
for a production system makes every command that writes ask for --yes.
Test suites of workbooks
A test suite is a folder of workbooks, each with the result it must give, in a small file next to
it. Setup steps create what the cases need, the cases plan or run, and the teardown removes what the
suite created, also after a failed case. A case can check the counts per sheet, single rows, the
columns of the preview, and a second plan after the run, which can require every row to read
unchanged.
fdi test runs the suite and writes a JUnit report for the build server.
A suite writes to Manage, so it runs only against a test system: the client and the app both
refuse it on production. Our pipeline runs the suite of our example workbooks after every deploy.
On the latest build it ended with 30 passed, 0 failed, teardown clean, in under two minutes.
You can build the same for your own workbooks: the loads of your go-live, run against a test system before each upgrade of Manage.
What comes next
The next article is about the values that Manage owns: dates and time zones, spaces, audit columns and generated keys. The Fiedler Data Import page lists the whole series.
Want to run Fiedler Data Import on your own cluster? Get in touch.
IBM and Maximo are trademarks of International Business Machines Corporation, registered in many jurisdictions worldwide.